A function is a relation that assigns to each number
in the domain exactly one number in the range. The
domain of a function is the set of possible inputs that
the function may assign to and produce meaningful outputs. The
range is the set of possible outputs.
In Lab 7, we used Excel formulas to produce a sequence frequencies of
musical notes. The Excel formula we used is an example of function.
Indeed, a function is frequently described by a formula (equality, to be
a more accurate). Another way to describe a function is to use a
graph.
Graph a Linear Function is
Excel
A linear function is determined by its slope m and the y-intercept b. If f is a linear function with the
slope and the y-intercept
b, then for any number x in the domain of f, there is an output, f(x), given by f(x) = mx + b.
One reason that the function defined by f(x) = mx + b
is called a linear function is that its graph is a line.
Example: Create a graph for the linear function
f(x) = 2x − 1 over
the domain − 5 ≤ x ≤ 5.
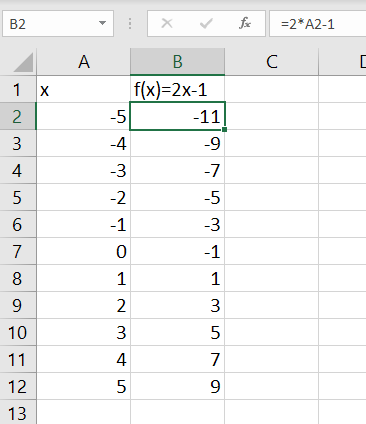
Solution: We start with creating a table which
consists of a column for x and
another column for f(x) = 2x − 1.
Input x in the cell
A1 and f(x) = 2x − 1 in
the cell B1.
Input -5, -4, -3 in the cells A2, A2
and A3 respectively and the use autofill to generate
numbers -2, -1, … 5.
Input =2*A2-1 in the cell B2 and use
autofill to generate the outputs for f.
image-20201130001227616
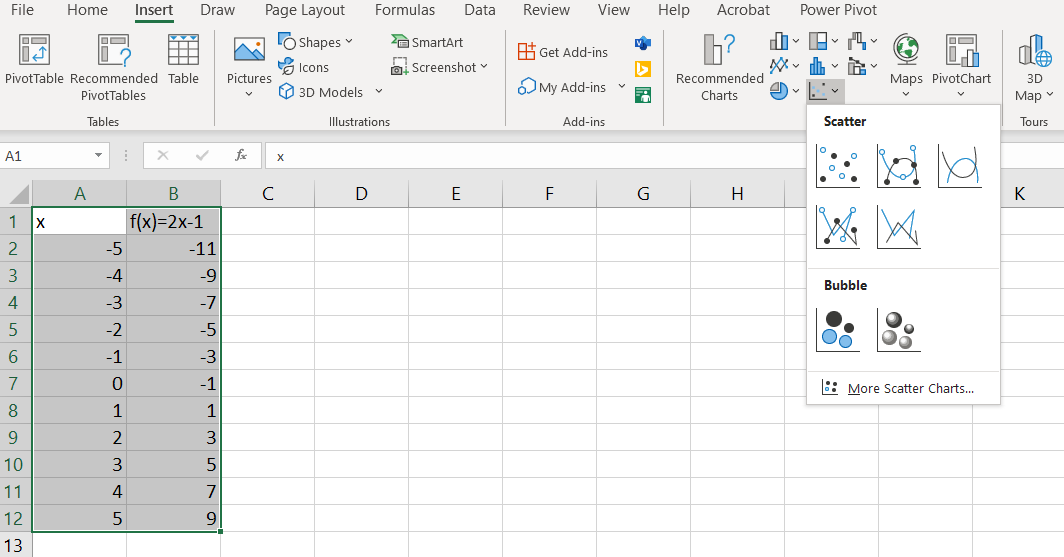
To create the graph, we use the scatter plot function of Excel.
Highlight the cells A1:B12. Then click
Insert and look for “Insert Scatter”.
image-20201130001935803
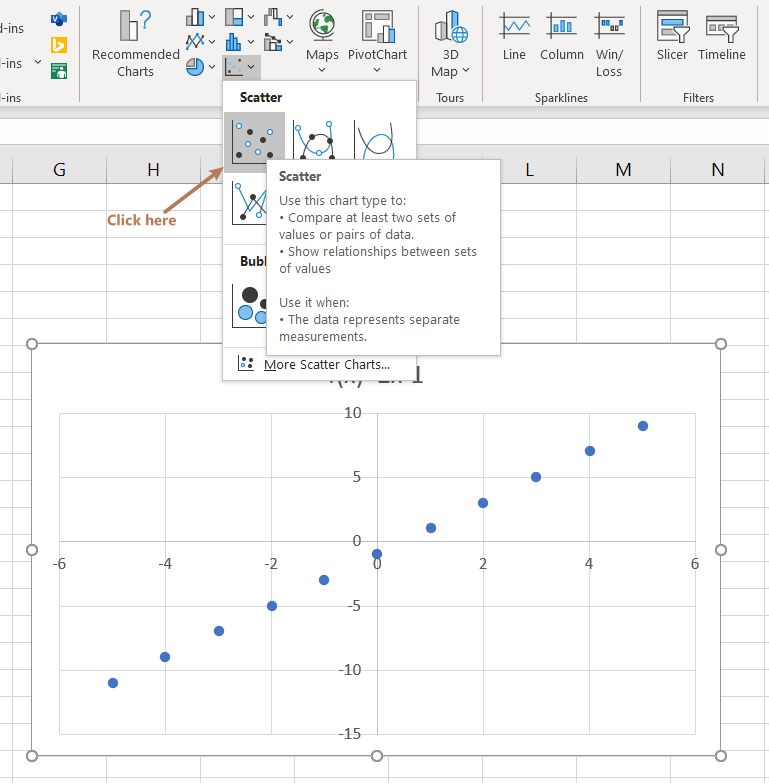
Click Scatter to create a scatter plot
image-20201130002125746
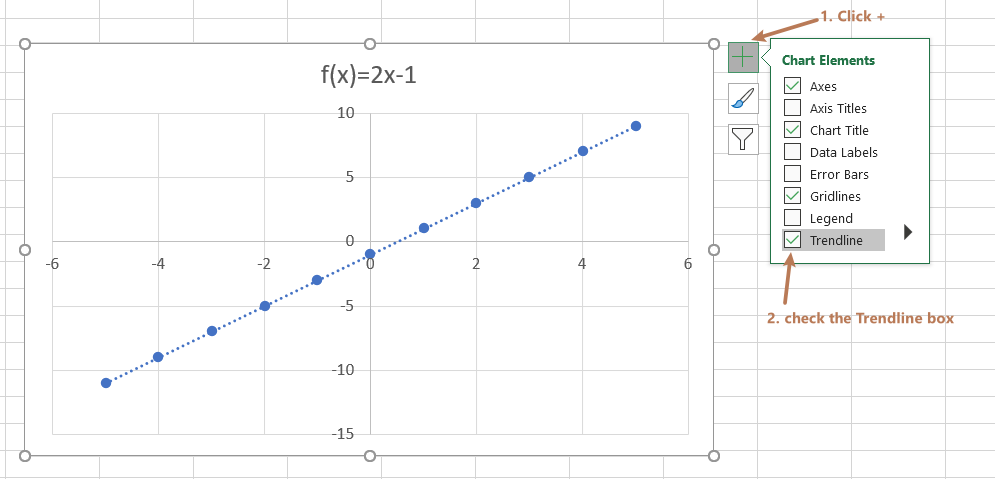
Select the chart, click + to add the trendline.
image-20201130002341199
Lab Assignment 8
Create a table consists of integer inputs and a graph for the
function f(x) = 3x − 2 over
the domain − 5 ≤ x ≤ 5.